
How to Calculate the ROI of Mexico Nearshoring Before You Move Production
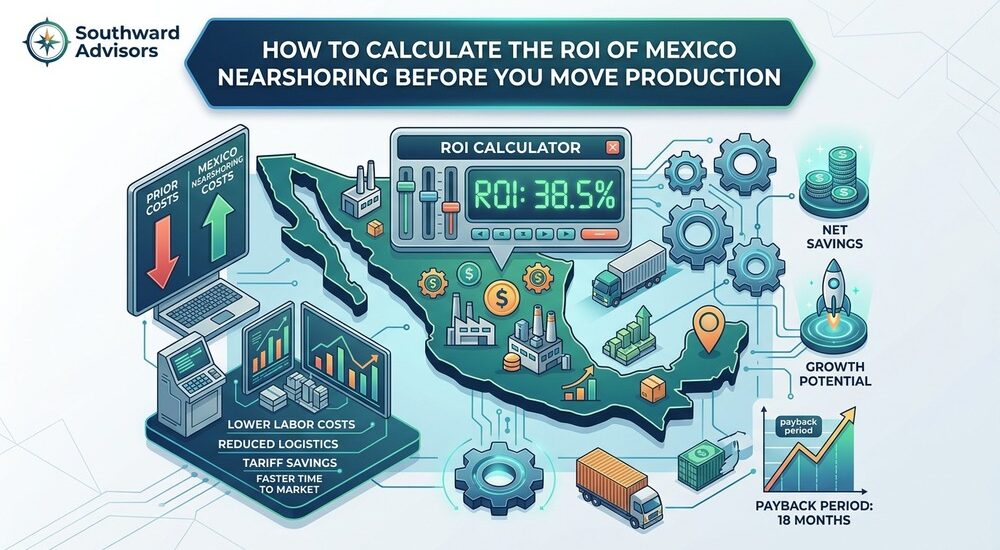
Moving production to Mexico can reduce manufacturing costs, shorten supply chains, improve access to U.S. markets, and create additional capacity. But none of those benefits automatically means a nearshoring project will generate an attractive financial return.
The right question is not simply, “Is manufacturing cheaper in Mexico?”
It is:
“After accounting for labor, materials, logistics, inventory, quality, capital investment, transition costs, taxes, customs, and risk, what return will this Mexico manufacturing strategy generate?”
That is the basis of a credible Mexico nearshoring ROI analysis.
Executive Summary: How Do You Calculate Nearshoring ROI?
A practical nearshoring business case follows ten steps:
- Establish the current production baseline.
- Calculate the fully loaded cost of current manufacturing.
- Estimate the fully loaded cost of Mexico production.
- Calculate one-time transition costs.
- Determine required capital investment.
- Calculate annual recurring savings.
- Calculate the payback period.
- Calculate ROI, NPV, and IRR.
- Test best-, base-, and worst-case scenarios.
- Evaluate strategic benefits and risks that may not appear in a simple ROI calculation.
The most important principle is simple: compare equivalent costs on an apples-to-apples basis.
Mexico’s manufacturing economics vary significantly by industry, location, labor mix, supply-chain structure, and production process. INEGI publishes manufacturing remuneration and productivity data by subsector, while current U.S. government guidance provides information on Mexico’s logistics, temporary imports, customs, and manufacturing environment. Those sources are useful for validating assumptions, but they should not replace company-specific quotes and operating data.
Why You Should Calculate Nearshoring ROI Before Moving Production
Nearshoring can look attractive when the analysis begins and ends with wages.
That approach is dangerous.
A plant that has lower direct labor costs can still have a higher total cost if it requires expensive equipment, duplicated production during the transition, additional management, higher freight, inefficient material flows, or significant quality investment.
The business case should therefore compare:
Current fully loaded production cost
versus
Mexico fully loaded production cost + transition costs + required investment + risk-adjusted cash flows.
Mexico’s manufacturing ecosystem is substantial: INEGI’s latest IMMEX statistics track thousands of manufacturing establishments and detailed data on employment, remuneration, consumption, and production.
That does not mean every manufacturer will achieve the same economics.
What Should Be Included in a Mexico Nearshoring ROI Model?
Your model should include at least five categories.
Current production costs
- Direct labor
- Indirect labor
- Materials and components
- Factory overhead
- Utilities
- Facility costs
- Maintenance
- Quality
- Scrap and rework
- Inventory
- Warehousing
- Transportation
- Freight
- Customs and duties where applicable
- Management
- Compliance
- Insurance
Mexico production costs
Use the same categories, then add Mexico-specific considerations such as cross-border transportation, customs administration, local professional services, workforce recruitment, supplier development, facility setup, and currency exposure.
One-time costs
- Facility preparation
- Equipment relocation
- Installation
- Validation
- Training
- Supplier qualification
- Travel
- Technology implementation
- Dual production
- Launch inventory
- Legal and professional services
Capital investment
- Machinery
- Tooling
- Automation
- IT
- ERP
- Material handling
- Quality systems
- Facility improvements
- Utilities infrastructure
Financial effects
- Annual operating savings
- Working-capital changes
- Tax effects
- Cash-flow timing
- Residual asset value
- NPV
- IRR
Step 1: Calculate Your Current Fully Loaded Manufacturing Cost
Start with what the business actually spends today.
Do not rely solely on standard cost.
For example, if a product has a factory cost of $20 per unit but requires $3 of freight, $1 of inventory carrying cost, $0.75 of quality/rework expense, and $0.25 of other supply-chain costs, the economic cost is not $20.
It is $25.
This is why executives should calculate total landed cost per unit, not simply factory cost per unit.
A useful structure is:
Total Cost Per Unit = Manufacturing + Logistics + Customs + Warehousing + Inventory + Quality + Other Relevant Costs
Calculate the current annual cost using actual production volume.
Step 2: Estimate the Fully Loaded Cost of Manufacturing in Mexico
Now build the same model for Mexico.
Do not start with a generic assumption such as “Mexico labor is 40% cheaper.”
Start with the actual operation.
Labor
Compare:
- Direct wages
- Benefits
- Employer payroll costs
- Overtime
- Supervisory labor
- Recruitment
- Training
- Turnover
- Absenteeism
- Productivity
- Workforce availability
INEGI publishes current manufacturing remuneration data by subsector, including wage and broader remuneration measures. Its latest published manufacturing data show why executives should use industry-specific information rather than a single national wage assumption.
The critical point is:
Lower wages do not automatically mean lower unit labor cost.
Suppose, purely as an illustrative example, a U.S. operator costs $30 per productive hour while a Mexican operator costs $12. If the U.S. operation produces 10 good units per productive hour and the Mexico operation initially produces only 6, labor cost per good unit may not fall as dramatically as the wage comparison suggests.
Productivity, training, absenteeism, turnover, line balance, automation, and quality all matter.
Step 3: Model Logistics, Inventory and Working Capital
Logistics must be modeled on an annual and per-unit basis.
Compare:
Current facility → customer
against
Mexico facility → customer
Include:
- Inbound freight
- Outbound freight
- Trucking
- Rail
- Cross-border transportation
- Customs brokerage
- Warehousing
- Inventory in transit
- Safety stock
- Distribution
- Expediting
- Packaging
Mexico’s logistics network provides significant road, rail, port, and border infrastructure, but logistics costs vary considerably by location and supply chain. The U.S. Commercial Service specifically notes that transportation logistics can represent a meaningful share of product costs in Mexico.
Do not assume that moving production closer to the U.S. automatically lowers freight cost. Model the actual origin, destination, shipment frequency, mode, border crossing, and product characteristics.
Inventory and Working Capital
Nearshoring may reduce pipeline inventory when lead times become shorter, but that benefit must be demonstrated rather than assumed.
Calculate:
- Raw-material days
- Work-in-process days
- Finished-goods days
- Pipeline inventory
- Safety stock
- Inventory carrying rate
- Cash tied up in inventory
For example, if a manufacturer carries $6 million of inventory at a 20% annual carrying cost, the economic carrying cost is $1.2 million per year.
If a redesigned supply chain reduces inventory to $4.5 million, the business may release $1.5 million of working capital and reduce annual carrying cost by $300,000.
Those are two separate financial benefits and should not be double-counted.
Step 4: Include Quality and Scrap
Quality belongs in the ROI model.
Measure:
- Scrap
- Rework
- Defects
- Inspection
- Supplier quality
- Warranty claims
- Returns
- Customer disruptions
- Quality personnel
A Mexico operation that has a lower conversion cost but a higher defect rate may produce little or no real savings.
For example, assume a fictional manufacturer produces 500,000 units annually. If quality-related losses are $1.00 per unit today, the annual cost is $500,000.
If the Mexico operation reduces that to $0.70 per unit, the model gains another $150,000 annually.
But if Mexico quality costs rise to $1.40 per unit during ramp-up, the expected savings disappear.
The correct approach is to model the ramp separately from steady-state production.
Step 5: Calculate One-Time Transition Costs
This is one of the most commonly underestimated parts of a nearshoring business case.
Potential costs include:
- Mexico entity setup
- Legal and professional services
- Site selection
- Facility preparation
- Equipment relocation
- Equipment installation
- Recruiting
- Training
- Travel
- Supplier qualification
- Product validation
- Pilot production
- Quality certification
- Dual production
- Temporary inventory
- Logistics testing
- Customs setup
- Technology implementation
- Management time
- Production disruption
Southward Advisors’ own Mexico sourcing experience emphasizes that supplier development can require multiple rounds of bidding, factory visits, and hands-on development rather than assuming that an existing Asian supply chain can simply be duplicated in Mexico.
Model these costs separately from steady-state operating costs.
Step 6: Calculate Required Capital Investment
How Much Capital Will the Mexico Move Require?
Potential CAPEX includes:
- Factory or facility
- Leasehold improvements
- Machinery
- Tooling
- Automation
- Material-handling systems
- IT infrastructure
- ERP
- Quality systems
- Warehouse
- Security
- Utilities
- Engineering
- Installation
- Commissioning
The distinction matters:
CAPEX is money invested to establish the operation.
Operating savings are recurring economic benefits generated by the operation.
A project can have large annual savings and still produce an unattractive return if the capital requirement is excessive.
Step 7: Calculate Annual Net Savings
A simple starting formula is:
Annual Net Savings = Current Annual Production Cost − Mexico Annual Production Cost − Additional Annual Mexico Costs
For example:
Current annual cost: $10.0 million
Mexico annual cost: $7.8 million
Gross annual savings: $2.2 million
If the Mexico operation requires another $300,000 in annual management, compliance, insurance, or other costs, then:
Annual Net Savings = $10.0M − $7.8M − $0.3M = $1.9M
Use the company’s actual numbers wherever possible.
Step 8: Calculate Payback Period and ROI
A simple payback calculation is:
Payback Period = Initial Investment + Transition Costs ÷ Annual Net Savings
Using a hypothetical $5 million total initial investment and $2 million annual net savings:
Payback = $5M ÷ $2M = 2.5 years
A simple ROI formula is:
ROI = (Net Benefit ÷ Investment) × 100
However, companies use different definitions of ROI. For major manufacturing projects, simple ROI should therefore be supplemented with discounted cash-flow analysis.
ROI vs. NPV vs. IRR: Which Should You Use?
| Metric | What it tells you | Why it matters |
| ROI | Return relative to investment | Easy executive comparison |
| Payback | How long until investment is recovered | Useful for liquidity and risk |
| NPV | Value created after discounting future cash flows | Better for investment decisions |
| IRR | Implied annualized return of project cash flows | Useful for comparing projects |
A project can have an attractive simple ROI but a weak NPV if most benefits arrive many years after a large upfront investment.
For significant capital projects, consider:
- Discount rate
- Cash-flow timing
- Taxes
- Depreciation
- NPV
- IRR
- Residual value
- Financing assumptions
Worked Example: Calculating the ROI of Moving Production to Mexico
The following is entirely hypothetical and is not presented as a typical Mexico manufacturing result.
Assume a U.S. manufacturer currently spends $10 million annually to manufacture a product.
The estimated fully loaded Mexico cost is $7.8 million annually.
That creates:
Annual gross savings = $10M − $7.8M = $2.2M
Assume:
- Facility and equipment investment: $4M
- Transition costs: $1M
- Total initial investment: $5M
Payback
$5M ÷ $2.2M = 2.27 years
Three-year cumulative benefit
$2.2M × 3 = $6.6M
$6.6M − $5M = $1.6M net cumulative benefit
Simple three-year ROI:
$1.6M ÷ $5M = 32%
Five-year cumulative benefit
$2.2M × 5 = $11M
$11M − $5M = $6M net cumulative benefit
Simple five-year ROI:
$6M ÷ $5M = 120%
These calculations exclude taxes, financing, depreciation, changing volumes, inflation, FX, and other factors. A professional investment model would incorporate those variables.
Fully Loaded Cost Per Unit: An Illustrative Comparison
Assume annual production of 400,000 units.
| Cost Category | Current Production | Mexico Production |
| Labor | $4.50 | $2.80 |
| Materials | $10.50 | $10.20 |
| Factory overhead | $4.00 | $2.70 |
| Logistics | $2.20 | $1.80 |
| Inventory | $1.00 | $0.70 |
| Quality | $0.80 | $0.60 |
| Other | $2.00 | $0.70 |
| Fully loaded unit cost | $25.00 | $19.50 |
At 400,000 units, the illustrative difference is:
$5.50 × 400,000 = $2.2 million annual savings
Again, these figures are fictional and should not be interpreted as typical Mexico costs.
Revenue-Side Benefits Should Also Be Considered
Nearshoring ROI is not necessarily limited to manufacturing cost reduction.
A Mexico operation may potentially influence:
- Customer lead times
- Delivery reliability
- Capacity
- Product availability
- Speed to market
- Customer service
- New customer opportunities
- Supply-chain resilience
These benefits should only be monetized when a defensible assumption exists.
For example, if a shorter lead time allows a company to avoid a known level of expedited freight, that benefit can be modeled.
If management believes faster delivery will generate unspecified “more sales,” it is better to identify the assumption separately rather than insert an arbitrary revenue figure into the ROI calculation.
10 Nearshoring Costs Companies Often Forget
- Dual production during transition
- Employee training
- Management travel
- Equipment relocation
- Validation and testing
- Supplier qualification
- Customs compliance
- Inventory carrying costs
- Quality ramp-up
- Business disruption
Other frequently overlooked items include IT integration, recruiting, engineering support, launch inventory, temporary warehousing, tooling modifications, and management time.
How to Perform a Risk and Sensitivity Analysis
The best Mexico nearshoring ROI model is not one number.
It is a range.
Build at least three scenarios.
| Scenario | Annual Net Savings | Initial Investment | Payback | 5-Year Simple ROI |
| Best case | $2.8M | $4.5M | 1.61 years | 211% |
| Base case | $2.2M | $5.0M | 2.27 years | 120% |
| Worst case | $1.2M | $6.5M | 5.42 years | -8% |
Illustrative only.
Test assumptions such as:
- Labor savings
- Wage inflation
- FX
- Freight
- Facility cost
- Production volume
- Scrap
- Productivity
- CAPEX
- Ramp-up period
- Customer demand
Currency deserves particular attention. Banco de México maintains daily peso/U.S. dollar exchange-rate series, which can be used as the starting point for an FX assumption rather than using an arbitrary exchange rate.
The model should then stress-test a range of exchange rates rather than assuming today’s rate will remain constant throughout the project’s life.
How to Calculate Your Nearshoring Break-Even Point
The break-even question is:
How much production must move to Mexico before the investment pays for itself?
A simple formula is:
Break-Even Volume = Initial Investment ÷ Savings Per Unit
Suppose:
- Initial investment = $5 million
- Savings per unit = $2.50
Then:
$5M ÷ $2.50 = 2 million units
The project must therefore generate approximately 2 million units of cumulative savings before recovering the initial investment under this simplified model.
A more sophisticated model should account for fixed costs, variable costs, ramp-up, changing production volumes, and the timing of cash flows.
When Nearshoring to Mexico May Not Make Financial Sense
Mexico is not automatically the best answer.
Nearshoring may not make financial sense when:
- Production volume is too small
- Labor represents a tiny portion of total cost
- The existing facility is exceptionally efficient
- Relocation costs are unusually high
- Specialized capabilities are unavailable locally
- Supplier development would be excessive
- Logistics become more expensive
- The Mexico operation requires substantial duplicated infrastructure
- The transition would materially disrupt customers
- Regulatory or operational complexity outweighs the economic benefit
The right conclusion may also be partial nearshoring rather than moving the entire operation.
A manufacturer might move selected components, labor-intensive assemblies, or incremental capacity to Mexico while retaining its existing U.S. plant.
Nearshoring ROI Checklist
Current State
- Current unit cost calculated
- Fully loaded manufacturing cost calculated
- Logistics costs calculated
- Inventory costs calculated
- Quality costs calculated
Mexico Model
- Labor costs estimated
- Facility costs estimated
- Utility costs estimated
- Supplier costs estimated
- Logistics costs estimated
- Customs costs reviewed
- Inventory impact modeled
- FX assumption established
Transition
- CAPEX estimated
- Relocation costs estimated
- Training costs estimated
- Dual production modeled
- Ramp-up costs modeled
- Validation costs modeled
Financial Model
- Annual savings calculated
- Payback calculated
- ROI calculated
- NPV calculated
- IRR considered
- Best case modeled
- Base case modeled
- Worst case modeled
What Data Do You Need to Build the Business Case?
Current Facility
Collect:
- Annual production
- Production by SKU
- Unit cost
- Direct labor
- Indirect labor
- Materials
- Overhead
- Utilities
- Facility costs
- Freight
- Inventory
- Quality costs
- Scrap
- Rework
- Warranty costs
Mexico
Estimate:
- Labor
- Benefits
- Facility
- Utilities
- Equipment
- Suppliers
- Materials
- Logistics
- Customs
- Taxes
- Inventory
- Quality
- CAPEX
- Transition costs
Financial Assumptions
Define:
- Production volume
- Growth
- Investment
- Project life
- Discount rate
- FX assumptions
- Wage inflation
- Material inflation
- Freight assumptions
- Ramp-up period
- Residual asset value
Should We Move Production to Mexico?
An executive decision should consider at least ten factors:
- Cost advantage — Is the fully loaded cost genuinely lower?
- Capital requirement — How much cash must be invested?
- Payback — How quickly is capital recovered?
- Supply-chain benefits — Does proximity improve the network?
- Customer benefits — Will service or lead time improve?
- Risk — How sensitive is the model to disruption?
- Scalability — Can the operation grow?
- Workforce — Is the required talent available?
- Strategic importance — Does Mexico support the company’s long-term strategy?
- Long-term economics — Does the project remain attractive under conservative assumptions?
ROI should be the financial foundation of the decision—not the only decision criterion.
How Southward Advisors Can Help
Southward Advisors helps U.S. manufacturers move from a nearshoring concept to an executable Mexico manufacturing strategy.
Its services include nearshore manufacturing support, strategic site selection, Mexico sourcing-agent support, supplier sourcing, supply-chain development, process improvement, and implementation/compliance oversight.
The firm can help manufacturers evaluate the operational and supply-chain factors that sit behind the financial model: where production should be located, which suppliers should be considered, how the supply chain should be developed, and how the Mexico operation can be implemented and improved.
Before moving production, manufacturers should build a detailed financial and operational business case—not simply compare Mexican wages with current labor costs.
Frequently Asked Questions
How do you calculate nearshoring ROI?
Calculate the difference between the current fully loaded production cost and the expected fully loaded Mexico cost, subtract recurring incremental costs, then compare the resulting annual net savings with the initial CAPEX and transition investment. Payback, ROI, NPV, and IRR should then be evaluated.
Is nearshoring to Mexico profitable?
It can be, but profitability depends on the company’s specific cost structure, production volume, logistics, labor productivity, investment requirements, supply chain, and risk profile. Mexico should not be assumed to produce a positive ROI before the business case is modeled.
How much can companies save by moving manufacturing to Mexico?
There is no universal savings percentage. Savings vary by industry, product, labor content, automation, materials, logistics, facility costs, tariffs, and production volume. Company-specific supplier quotes and operating assumptions are more useful than generic savings claims.
What costs should be included in a nearshoring business case?
Include labor, materials, overhead, utilities, facilities, maintenance, logistics, customs, inventory, quality, management, insurance, CAPEX, transition costs, working capital, and other relevant operating costs.
What is the payback period for moving manufacturing to Mexico?
Payback equals the initial investment and transition costs divided by annual net savings. The actual result depends entirely on the project’s cash flows.
Is Mexico cheaper than manufacturing in the United States?
Mexico can have lower manufacturing costs in some industries and operating models, but the comparison should be based on fully loaded cost per good unit rather than wages alone. INEGI provides manufacturing remuneration and productivity data that can help establish assumptions.
What are the hidden costs of nearshoring?
Common hidden costs include dual production, training, equipment relocation, validation, supplier qualification, customs setup, inventory, quality ramp-up, travel, IT implementation, and business disruption.
How do you calculate the total cost of manufacturing in Mexico?
Add manufacturing conversion costs, materials, labor, overhead, logistics, customs and duties where applicable, warehousing, inventory carrying costs, quality costs, management, compliance, and other relevant expenses. Then divide the annual total by good units produced.
How do you compare Mexico manufacturing costs with China?
Use the same fully loaded model for both countries. Include factory cost, labor, materials, freight, duties, inventory, quality, lead time, working capital, tariffs where applicable, and transition costs. Do not compare Mexico factory cost against China landed cost.
Should I move my factory to Mexico?
Not necessarily. The answer depends on the financial return, investment required, production volume, supply-chain strategy, workforce availability, risk, and long-term scalability. In some cases, moving only part of production is more attractive than relocating an entire factory.
How does currency affect Mexico nearshoring ROI?
A manufacturer with significant peso-denominated expenses and U.S.-dollar revenue or reporting can be affected by exchange-rate movements. The financial model should test multiple FX assumptions rather than relying on a single current exchange rate. Banco de México publishes the official daily exchange-rate series.
Does IMMEX automatically make manufacturing in Mexico cheaper?
No. IMMEX can provide important customs and tax-related benefits for qualifying operations, but the treatment depends on the specific operation and compliance requirements. Current U.S. government guidance notes that temporary entry benefits are conditional and subject to Mexican government requirements.
What is more important: ROI or payback period?
Both answer different questions. ROI measures return relative to investment, while payback measures how quickly the investment is recovered. For significant manufacturing investments, NPV and IRR should also be considered.
What is the biggest mistake in a Mexico nearshoring ROI analysis?
Using labor savings as the business case. A credible model must include logistics, inventory, quality, capital, transition costs, productivity, customs, management, and risk.
Can a company nearshore only part of its production?
Yes. A partial or phased strategy can sometimes reduce transition risk while allowing the company to test supplier capability, labor economics, logistics, and quality before committing to a larger relocation.
The strongest Mexico nearshoring business cases are not built on the assumption that Mexico is simply a lower-cost manufacturing location.
They are built by answering a harder question:
What will this supply chain actually cost after we move it, and what return will the investment generate?
Start with the current operation. Build a fully loaded cost baseline. Develop a Mexico model using actual supplier, labor, facility, logistics, and investment assumptions. Add transition costs. Model working capital and quality. Then test the project under multiple scenarios.
If the economics remain attractive after conservative assumptions, the project has a stronger foundation for executive approval.
If they do not, the analysis has still done its job.
It may show that production should remain where it is, that only part of the operation should move, or that the Mexico strategy needs to be redesigned before capital is committed.
The objective is not to prove that nearshoring works. The objective is to determine whether it works for your business.
Financial disclaimer: The calculations and examples in this article are for educational purposes only. Actual nearshoring ROI depends on a company’s production volumes, labor, logistics, facility, capital, tax, customs, supply-chain, and other operating assumptions. Companies should validate their financial model with qualified financial, tax, legal, and operational advisors before making an investment decision.